Sea Level Rise, Climate Change & Design
Through a UGA Public Service and Outreach Fellowship in 2013, I was fortunate to begin collaboration in the joint work of three public service units at UGA as they assisted coastal communities in preparing for sea-level rise and increasing hazards related to extreme weather events. These multi-year, NOAA-funded projects aimed to help governments create plans, assess vulnerabilities in their communities, educate the public, and adapt policies in preparation for impending economic and environmental change. As part of the project team, I used effective visual design as intermediary in making the complex clear, enhancing understanding and building trust between government entities and the governed.
Much of my contribution to these projects (through 2017) involved visualizing complex information such as predicted sea level rise scenarios for lay audiences. I was also involved in general presentation graphics, project branding and publication, and report design at various stages.
The final plans have emerged as models for other coastal communities across the country. The Tybee Island project won a National Sea Grant Superior Outreach Programming Award and has received significant press as a first-of its kind sea level rise planning collaboration, including mention in the New York Times, in this article, “Flooding of Coast, Caused by Global Warming, Has Already Begun”.
…………………………………………………………………………………………………………………………
Projects: Tybee Island: Developing a 50-year Climate Adaptation Plan for a Highly Vulnerable Barrier Island Community and Implementing Comprehensive Community Planning in St. Marys GA and Hyde County, NC.

Visualizations of NOAA Sea-Level Rise Data
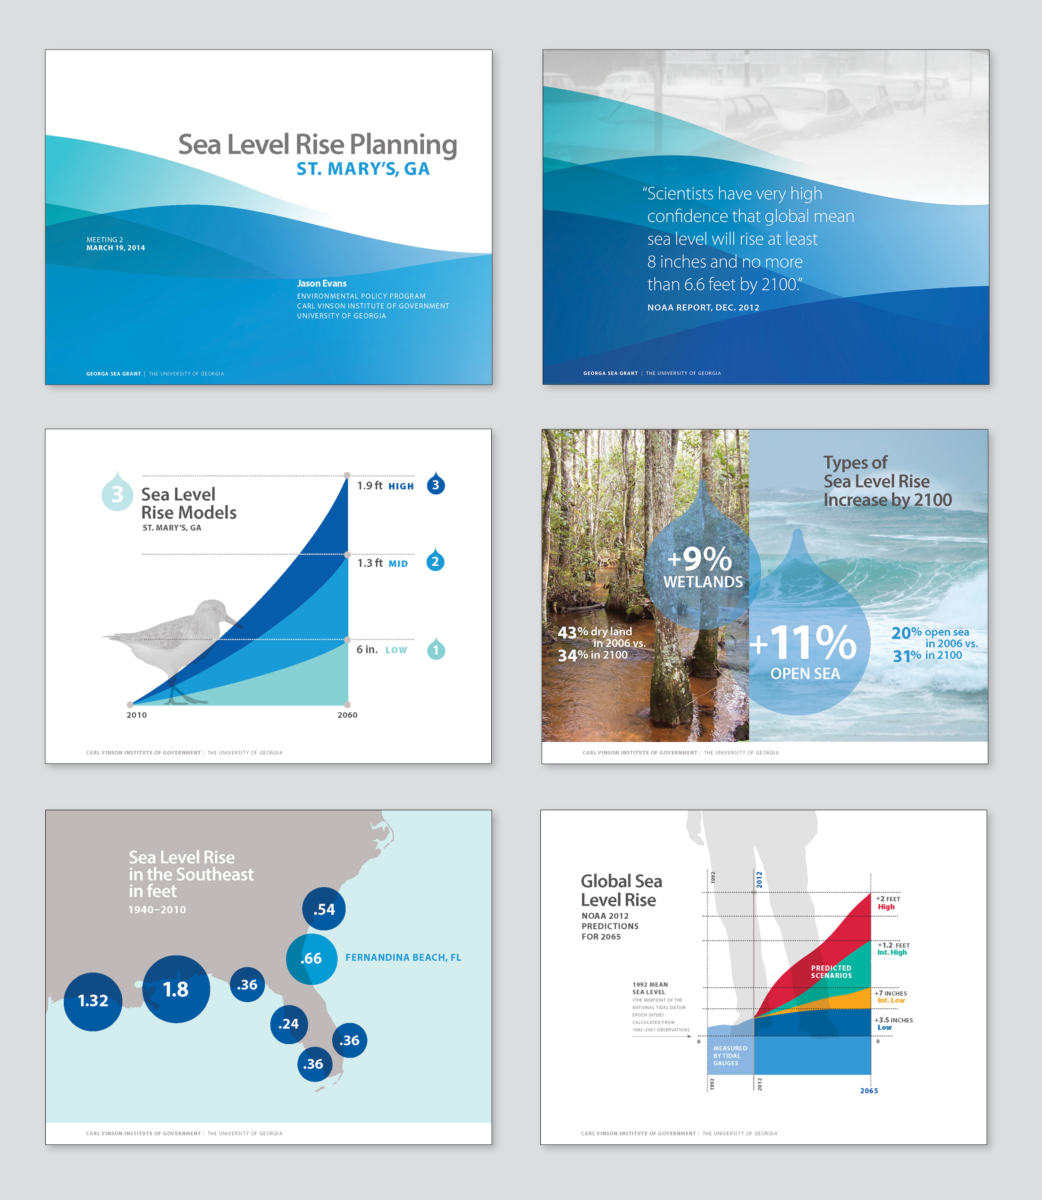
My initial work involved visualizing information and/or data, such as predicted sea-level rise scenarios, for non-science audiences like local community stakeholders in Tybee Island, and later St. Marys, GA and Hyde County, NC, who were ultimately making decisions based on the information provided from the project team about how their community would prepare for and mitigate increased coastal hazards. Ultimately, St. Marys was able to lower their risk from tidal flooding and decrease their federal flood insurance community rating (CRS) which saved community members on insurance premiums.

Data includes future sea level rise scenario predications for 50 and 100 years.

Presentation Graphics & Data Display
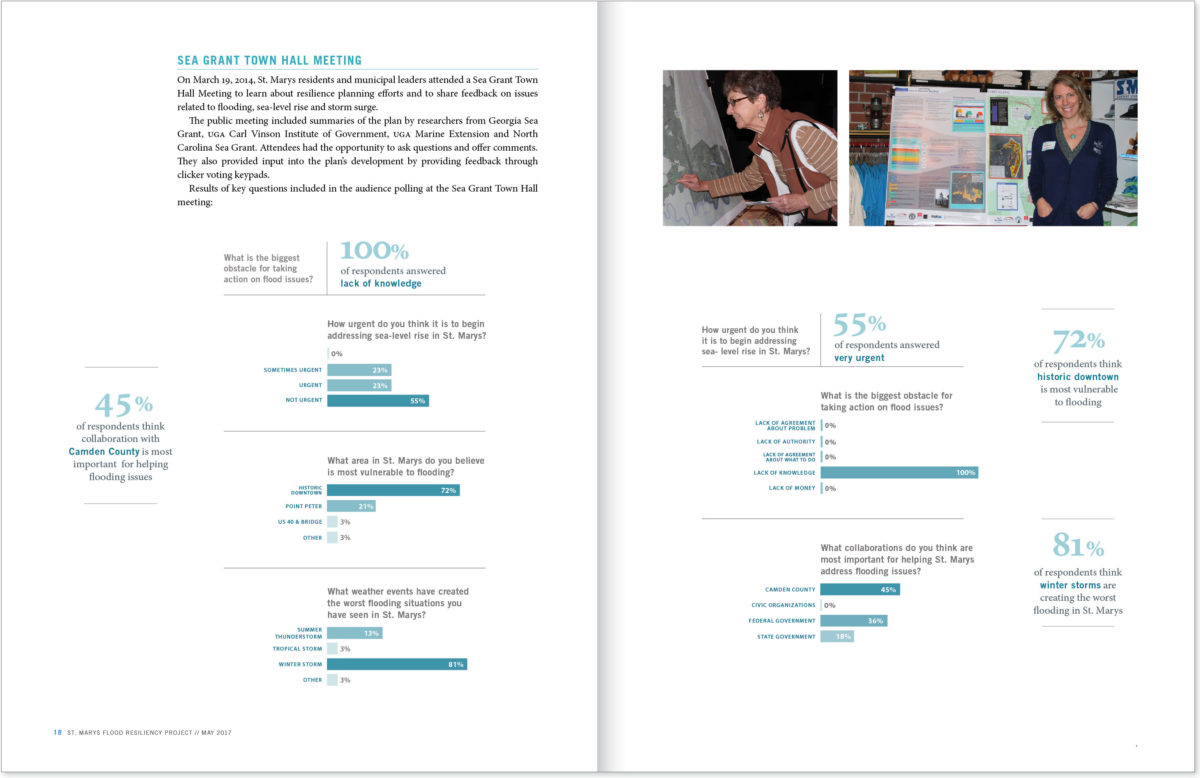
These graphics were used in various contexts, including at community stakeholder meetings and more generally when the project team members speak on topics related to sea-level rise and climate change, such as this.

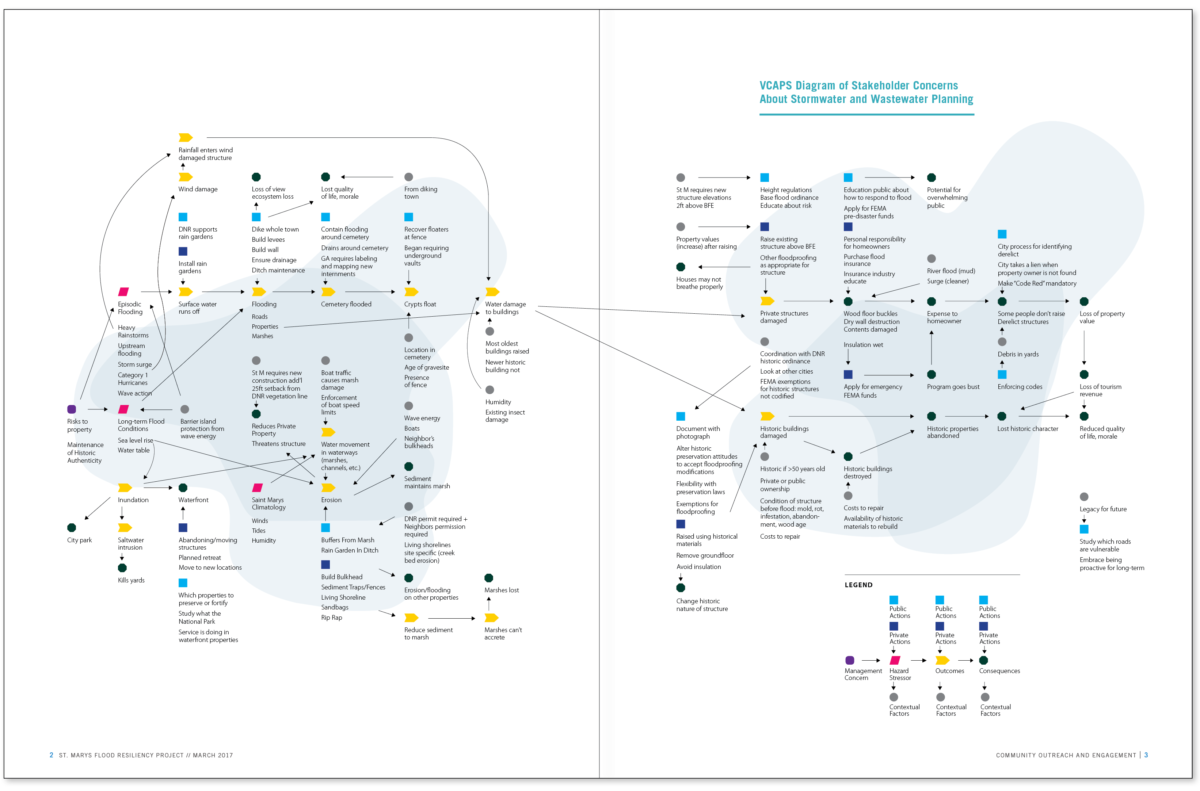
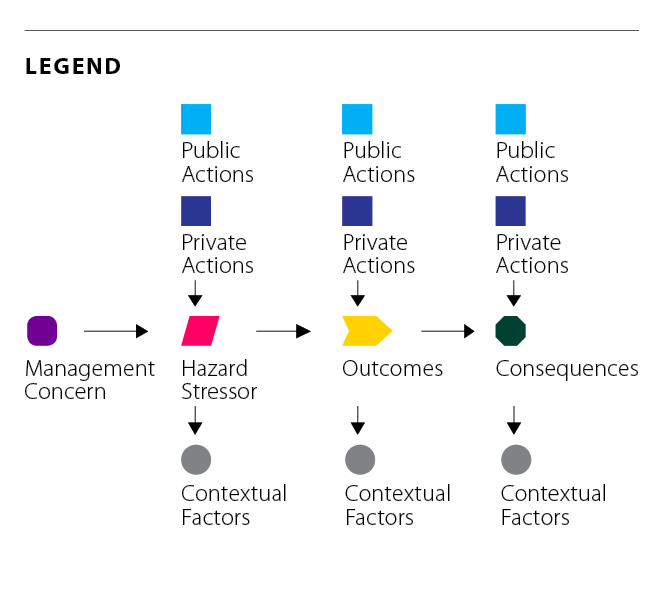
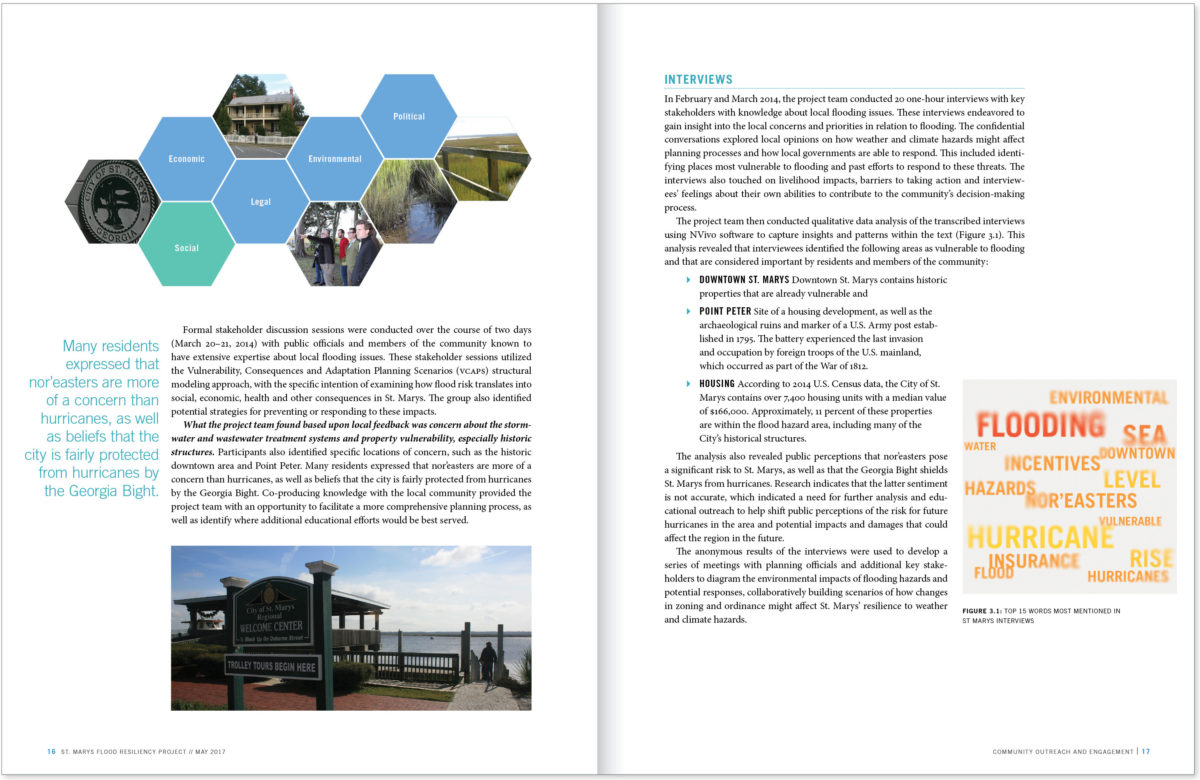
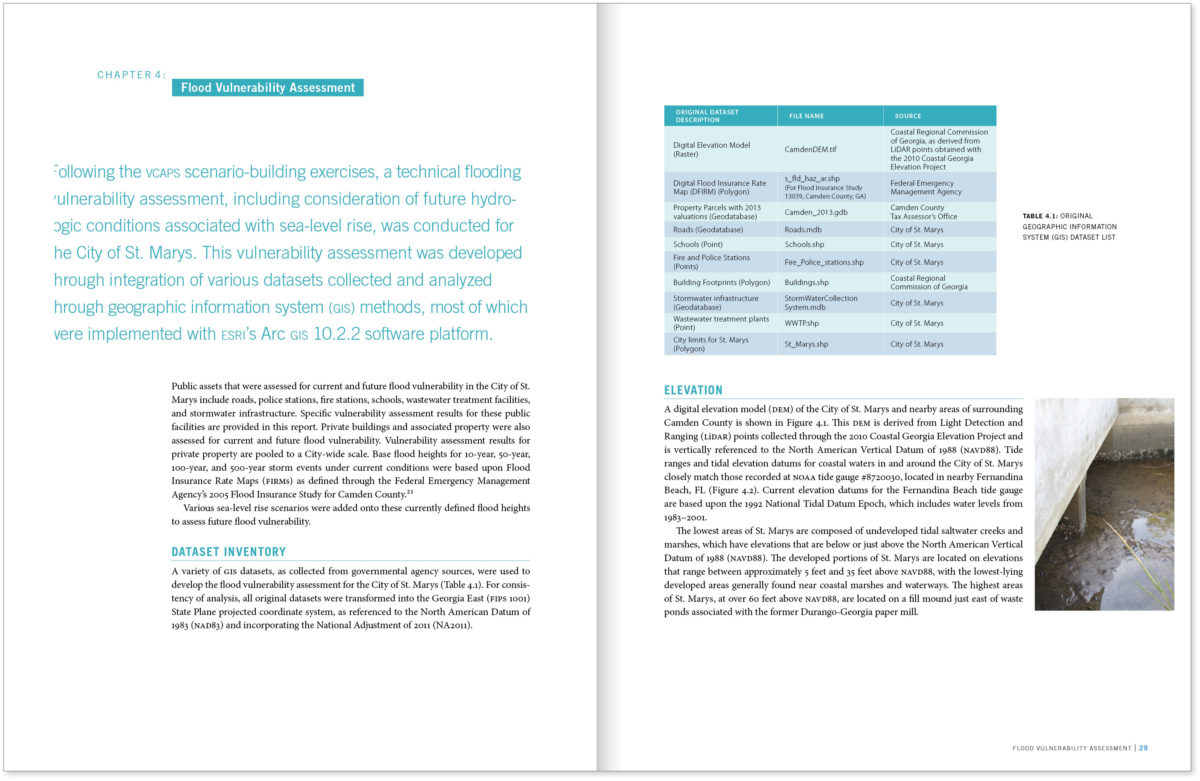
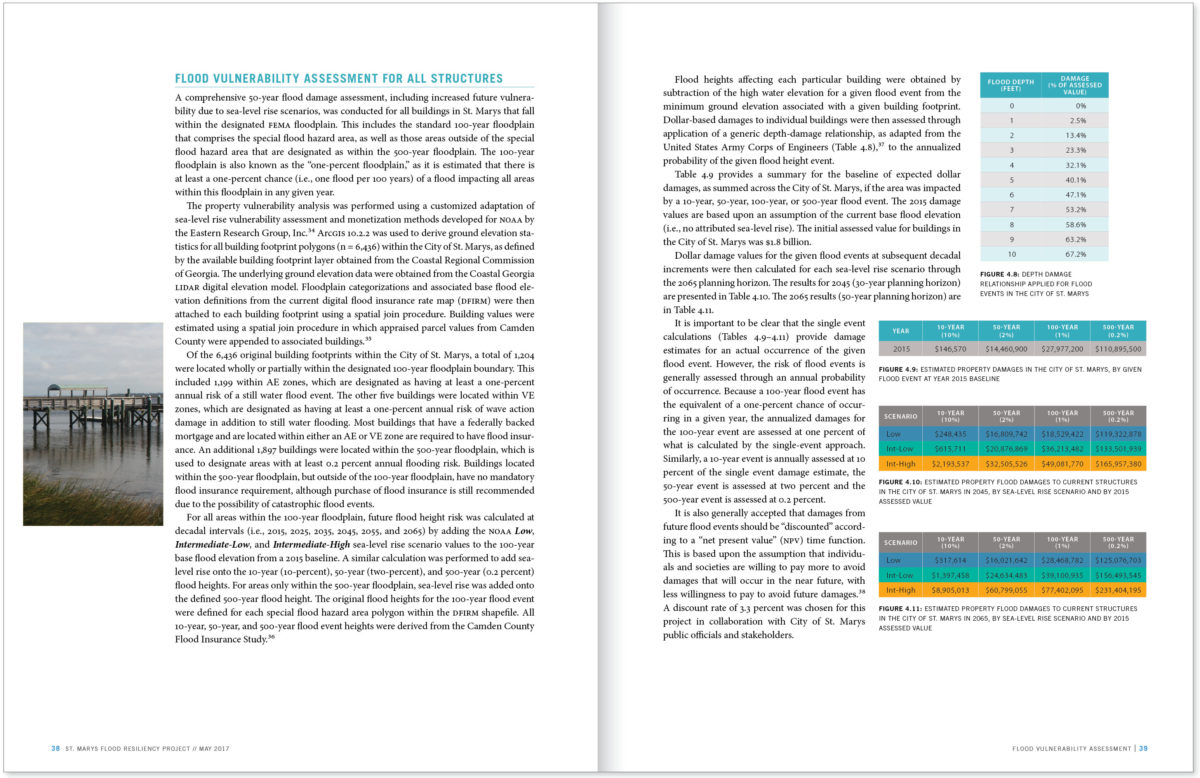
Publications Design: Final Project Reports

Conference Poster Template